Reports
Revenue, costs and orders over the period you choose: a basic report for every account, and more reports with the Accounting sync or the Inventory sync.
Selling → Reports shows what you sold over a period. Every account gets the basic report. With the Accounting sync or the Inventory sync, on trial or paid, the page has more: comparing periods, profit after costs and fees, and breakdowns by platform, item and location.
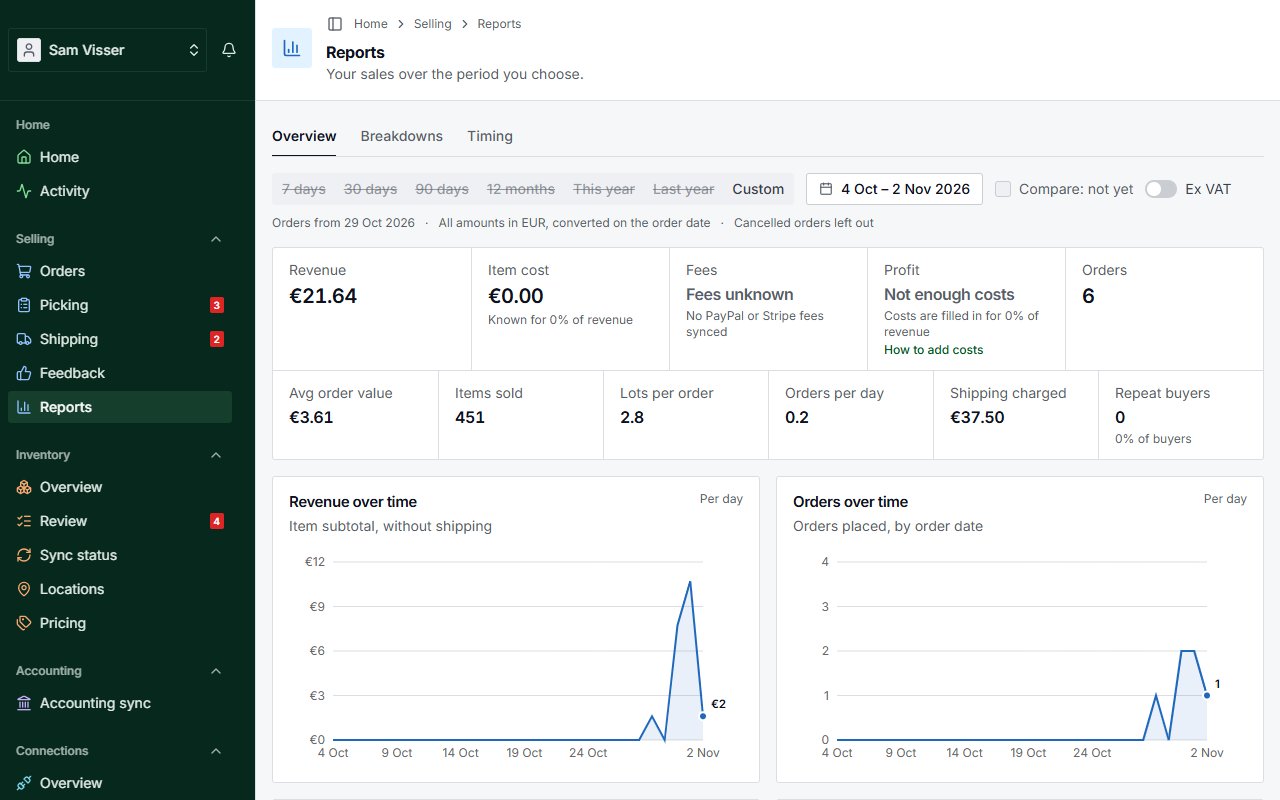
Table of Contents
The basic report
Choose a Period: This month (where the page starts), Last month, This quarter, Last quarter, This year, Last year, or Custom with a from and to date and Apply. Switch on Show ex-VAT amounts to see the amounts without VAT.
The page then shows:
- the key figures for the period: Revenue, Margin, Shipping, Handling, Costs and Orders
- Monthly revenue trend, the total amount per month
- Revenue by country, the order totals per destination country with the number of orders, the total with and without VAT, and the share of each country. This is the table you need for OSS or IOSS reporting.
Amounts are shown per currency, as they are on the order: orders in euros and orders in dollars get their own figures. Export to Excel downloads the report for the period.
Without the Accounting sync and the Inventory sync, a line under the report says what the extended reports add, with See what's included. Hide for this session hides it for now.
The extended reports
With the Accounting sync or the Inventory sync, the page has three tabs: Overview, Breakdowns and Timing. All amounts are converted to one currency on the order date, so orders in other currencies add up. A line above the report says from which date your orders count, that cancelled orders are left out, and which time zone the times are in.
While BrickInvoice is still fetching your order history from the stores, the line says how far it is ("Fetching order history, 4 of 12 months") and the months still missing are shaded.
Period and comparison
Choose a Period: 7 days, 30 days (where the page starts), 90 days, 12 months, This year, Last year, or Custom for a range of up to five years. A period that starts before your order history cannot be chosen.
Compare compares the period with the one of the same length directly before it. It is on when you open the page. The key figures then show the change as an arrow and a percentage, and the charts get a second line for the earlier period. When your order history does not reach back far enough, the switch reads Compare: not yet.
Ex VAT shows every amount without VAT.
The period, the tab and the switches are part of the page address, so you can bookmark a report or share its link.
Overview
The key figures:
- Revenue, Orders, Avg order value, Items sold, Lots per order, Orders per day, Shipping charged and Repeat buyers (with their share of all buyers).
- Item cost, with the share of revenue it is known for. The cost comes with the order: fill in My Cost on your lots on BrickLink or Brick Owl. Orders placed before you filled it in have no cost, so the share grows as new orders come in. How to add costs explains this on the page.
- Fees: the PayPal and Stripe fees that were synced. Without them the figure says Fees unknown.
- Profit: revenue minus item cost and fees, over the share of revenue that has a cost. With too few costs filled in, it says Not enough costs.
Below them, Revenue over time (the item subtotal, without shipping) and Orders over time show the period per day, per week or per month, depending on its length. Top items by revenue and Top items by quantity list what sold best.
Breakdowns
- Where your revenue comes from: revenue per platform, then per item type (parts, minifigures, sets), split into new and used.
- Category: revenue per BrickLink category. An order counts once in every category it has, so the orders do not add up to the total.
- Buyer country and Shipping method (as the buyer chose it).
- Top customers, by username and country only.
- Profit by category: revenue minus item cost for the BrickLink order lines that have a cost. Brick Owl gives one cost per order, so Brick Owl orders count in Profit on Overview, not here.
- Locations: order lines per series of storage locations, with the pieces, the lines marked not found while picking, and the pick accuracy. A series can be flagged No location, Not picked yet or Often short. The location is the remarks field of the lot on BrickLink, or the personal note on Brick Owl.
Timing
When orders come in shows the orders per hour and weekday in the period, and the busiest slot. Orders per day is a calendar of the last 12 months, whatever period you chose, with the number of days with orders, the longest gap and the busiest day.
Exporting
Each table on Overview and Breakdowns has its own Export button, which downloads that table as an Excel file.